ProTop
The Best OpenEdge Monitoring, Performance and Alerting Tool in the Galaxy!
ProTop helps you maximize the efficiency of your systems and quickly find and fix performance drains.
ProTop excels at detecting anomalies early, allowing you to fix them before your critical systems are affected.
ProTop upgrades your piecemeal monitoring scripts with the comprehensive, OpenEdge focused tooling used in the most demanding environments in the world.
The average hourly downtime cost in 2017 was over $300,000. ProTop’s proactive approach minimizes the risk of unexpected outages and helps provide quicker resolutions if they do occur.
ProTop helps streamline your day-to-day database management tasks so your staff can focus on their primary activities. If there’s a problem, ProTop will alert your team.
Anyone can claim to be an expert, but as one of our customers told us when selecting White Star Software and ProTop for their OpenEdge support, monitoring and alerting needs: “We already have enough cooks in the kitchen. We need a chef.”
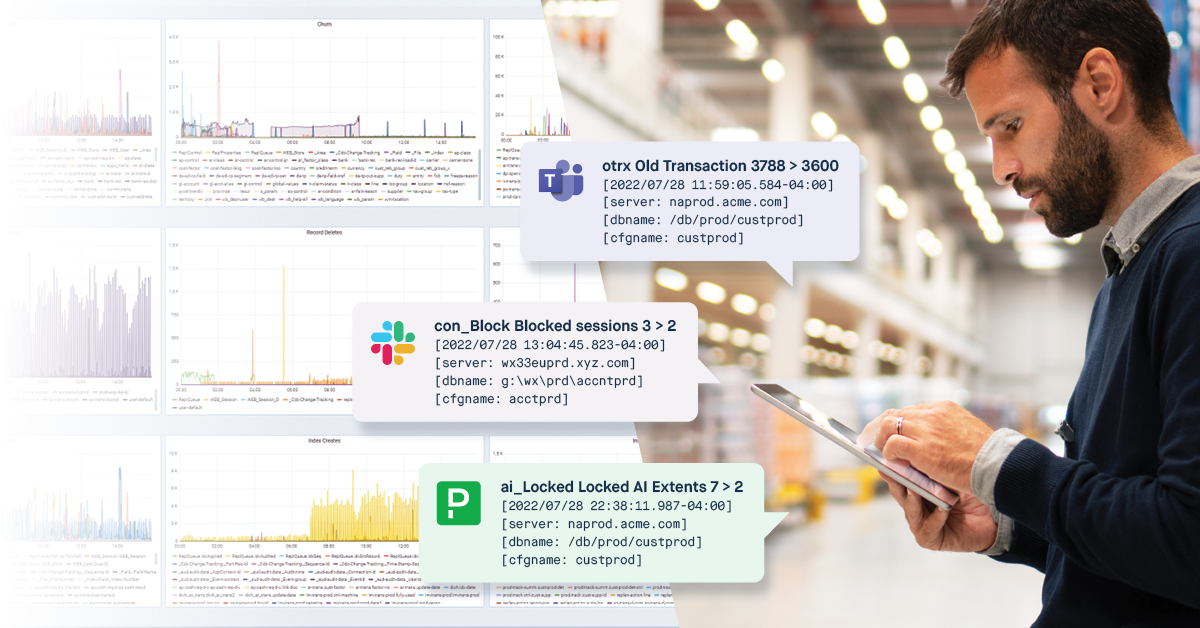
Our color-coded web and mobile dashboards give you an instant, at-a-glance view of the status of your monitored resources.
The Trends dashboard allows you to visualize changes over weeks and months or alternately zoom in to the minutes when a problem was affecting your business.
Alert configuration is fast, easy and flexible. Set one alert level or escalate with multiple thresholds associated with different severity levels. Keep the noise level to a minimum with custom nag intervals. Scriptable actions allow you to automate responses.
ProTop automatically gathers the information you need to respond to a business critical interruption. Resolve issues quickly rather than wasting time digging for data.
Easily access the ProTop dashboard using any device. At work, at home or on the road, the status of your Progress environment is never more than a click away.
Free
Your Text
Your Text
Your Text
Email Previews
Builder
Page Testing
Page Testing
Page Testing
Spam Filter Tests
500,000 Tracking Opens
2 Users Free
2 Users Free
2 Users Free
2 Users Free
2 Users Free
2 Users Free
2 Users Free
2 Users Free
2 Users Free
2 Users Free
2 Users Free
2 Users Free
2 Users Free
2 Users Free
FREE
Starting at
0$/month
User Interface
Real Time Monitor
Partial Alert Dashboard
Partial Trends Graphs
Historical Trends Graphs
48 hr History
Main, Configuration
Monitoring
Limits: 1 server, 5 DBs
Support
Best Effort Business Hours
Basic
Starting at
225$/month
User Interface
Real Time Monitor
Full Alert Dashboard
Partial Trends Graphs
Historical Trends Graphs
30 day History
Main, Configuration
Alerting
Monitoring
Limits: 1 Server,
10 DBs, 100 Users
Support
On Demand
Advanced
Starting at
425$/month
User Interface
Real Time Monitor
Full Alert Dashboard
Partial Trends Graphs
Historical Trends Graphs
1 yr History
Main, Configuration, Table and Index, Apsv/PASOE
Alerting
Monitoring
Limits: 5 Servers, 1000 Users
Classic AppServers, PASOE
Alert Enhancers
Application
System Health & Maintenance
DBA Toolkit
Support
Business Hours or 24/7/365 Available
Enterprise
Starting at
850$/month
User Interface
Real Time Monitor
Full Alert Dashboard
Full Trends Graphs
Historical Trends Graphs
3 yr History
Main, Configuration, Table and Index, Apsv/PASOE,
Latches, DB Analysis, SLA, Server
Alerting
Email, Slack, Jira, Teams
Monitoring
Limits: 2500 Users
Classic AppServers, PASOE
Alert Enhancers
Application, Pro2, Replication and Custom
Application Log File
Automated
Response
System Health & Maintenance
DBA Toolkit
Automatic Health Check
Support
Business Hours or 24/7/365 Available
Ultimate
Starting at
1700$/month
User Interface
Real Time Monitor
Full Alert Dashboard
Full Trends Graphs
Historical Trends Graphs
Unlimited Web History
Main, Configuration, Table and Index, Apsv/PASOE,
Latches, DB Analysis, SLA, Server
Alerting
Email, Slack, Jira, Teams, Custom
Monitoring
Limits: none
Classic AppServers, PASOE
Alert Enhancers
Application, Pro2, Replication and Custom
Application Log File
Automated
Response
System Health & Maintenance
DBA Toolkit
Automatic Health Check
Support
Business Hours Included. 24/7/365 Available
Free
Your Text
Your Text
Your Text
Email Previews
Builder
Page Testing
Page Testing
Page Testing
Spam Filter Tests
500,000 Tracking Opens
2 Users Free
2 Users Free
2 Users Free
2 Users Free
2 Users Free
2 Users Free
2 Users Free
2 Users Free
2 Users Free
2 Users Free
2 Users Free
2 Users Free
2 Users Free
2 Users Free
FREE
Starting at
0$/month
User Interface
Real Time Monitor
Partial Alert Dashboard
Partial Trends Graphs
Historical Trends Graphs
48 hr History
Main, Configuration
Alerting
Monitoring
Limits: 1 server, 5 DBs
System Health & Maintenance
Support
As Available Business Hours
Basic
Starting at
225$/month
User Interface
Real Time Monitor
Full Alert Dashboard
Partial Trends Graphs
Historical Trends Graphs
30 day History
Main, Configuration
Alerting
Monitoring
Limits: 1 Server,
10 DBs, 100 Users
System Health & Maintenance
Support
Best Effort Business Hours
Advanced
Starting at
425$/month
User Interface
Real Time Monitor
Full Alert Dashboard
Partial Trends Graphs
Historical Trends Graphs
1 yr History
Main, Configuration, Table and Index, Apsv/PASOE
Alerting
Monitoring
Limits: 5 Servers, 1000 Users
Classic AppServers, PASOE
Alert Enhancers
Application
System Health & Maintenance
DBA Toolkit
Support
Business Hours or 24/7/365 Available
Enterprise
Starting at
850$/month
User Interface
Real Time Monitor
Full Alert Dashboard
Full Trends Graphs
Historical Trends Graphs
3 yr History
Main, Configuration, Table and Index, Apsv/PASOE,
Latches, DB Analysis, SLA, Server
Alerting
Email, Slack, Jira, Teams
Monitoring
Limits: 2500 Users
Classic AppServers, PASOE
Alert Enhancers
Application, Pro2, Replication and Custom
Application Log File
Automated
Response
System Health & Maintenance
DBA Toolkit
Automatic Health Check
Support
Business Hours or 24/7/365 Available
Ultimate
Starting at
1700$/month
User Interface
Real Time Monitor
Full Alert Dashboard
Full Trends Graphs
Historical Trends Graphs
Unlimited History
Main, Configuration, Table and Index, Apsv/PASOE,
Latches, DB Analysis, SLA, Server
Alerting
Email, Slack, Jira, Teams, Custom
Monitoring
Limits: none
Classic AppServers, PASOE
Alert Enhancers
Application, Pro2, Replication and Custom
Application Log File
Automated
Response
System Health & Maintenance
DBA Toolkit
Automatic Health Check
Support
Business Hours Included. 24/7/365 Available